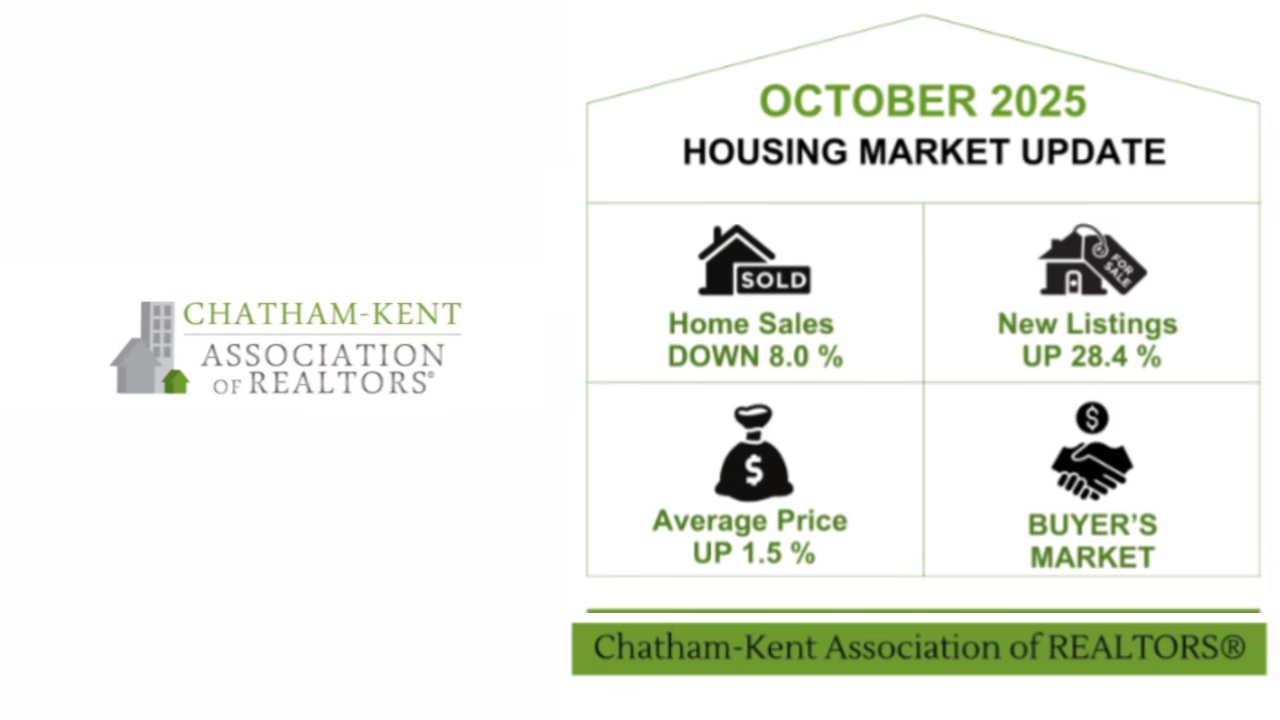
The number of homes sold through the MLS® System of the Chatham-Kent Association of REALTORS® totaled 104 units in October 2025. This was a decline of 8% (nine sales) from October 2024.
Home sales were 10.5% below the five-year average and 15.2% below the 10-year average for the month of October.
On a year-to-date basis, home sales totaled 1,044 units over the first 10 months of the year. This was down by 6% from the same period in 2024.
“Sales were down on a year-over-year basis in October, although there has been a marked improvement when looking at the monthly data since the beginning of the year,” said Barbara McCaughrin, President of the Chatham-Kent Association of REALTORS®. “New listings set a new record for the month of October as sellers were more determined than ever to attract buyers to their properties. Overall inventory levels now stand at their highest in a decade as supply continues to outpace demand in our region. In more positive news, the Municipality of Chatham-Kent continues to purchase more land to build affordable and supportive housing, approving the acquisition of four more properties in October.”
The average price of homes sold in October 2025 was $419,216, a minor increase of 1.5% from October 2024.
The more comprehensive year-to-date average price was $431,634, a small gain of 1.3% from the first 10 months of 2024.
The dollar value of all home sales in October 2025 was $43.6 million, falling by 6.6% from the same month in 2024.
The number of new listings saw a gain of 28.4% from October 2024. There were 298 new residential listings in October 2025. This was also the largest number of new listings added in the month of October in history.
New listings were 29.3% above the five-year average and 51.6% above the 10-year average for the month of October.
Active residential listings numbered 564 units on the market at the end of October, up by 18.2% from the end of October 2024. Active listings haven’t been this high in the month of October in more than a decade.
Active listings were 39.1% above the five-year average and 68.4% above the 10-year average for the month of October.
Months of inventory numbered 5.4 at the end of October 2025, up from the 4.2 months recorded at the end of October 2024 and above the long-run average of 3 months for this time of year. The number of months of inventory is the number of months it would take to sell current inventories at the current rate of sales activity.
Chatham Kent Association of REALTORS®.
To learn more, visit CKAR